

How Does HF Radio Propagation Work? - HF Path serise 1
by Brian ·
Published
· 7 min read
HF radio propagation is the way high frequency radio signals travel from a transmitter to a receiver. For long distance communication, the key is the ionosphere: an electrically charged part of the upper atmosphere that can bend suitable radio waves back toward Earth. That makes it possible to reach beyond the horizon without a satellite or an internet connection between the two stations.
Why, then, can you hear a distant station one evening and lose it the next? Think of HF as a journey through a changing environment. The route, frequency, sunlight and conditions along the way all matter. This first article in HF Path explains that journey, then shows you how to explore it in IonoFlux.
What does HF mean?
HF stands for high frequency, the radio band from 3 to 30 MHz. Much of what listeners call shortwave radio lies in this range. Amateur radio operators also describe bands by wavelength: the 20 metre band is around 14 MHz, while 40 metres is around 7 MHz. A band name identifies a range, rather than one exact channel.
How does a signal get beyond the horizon?
A radio signal can reach a receiver along different paths:
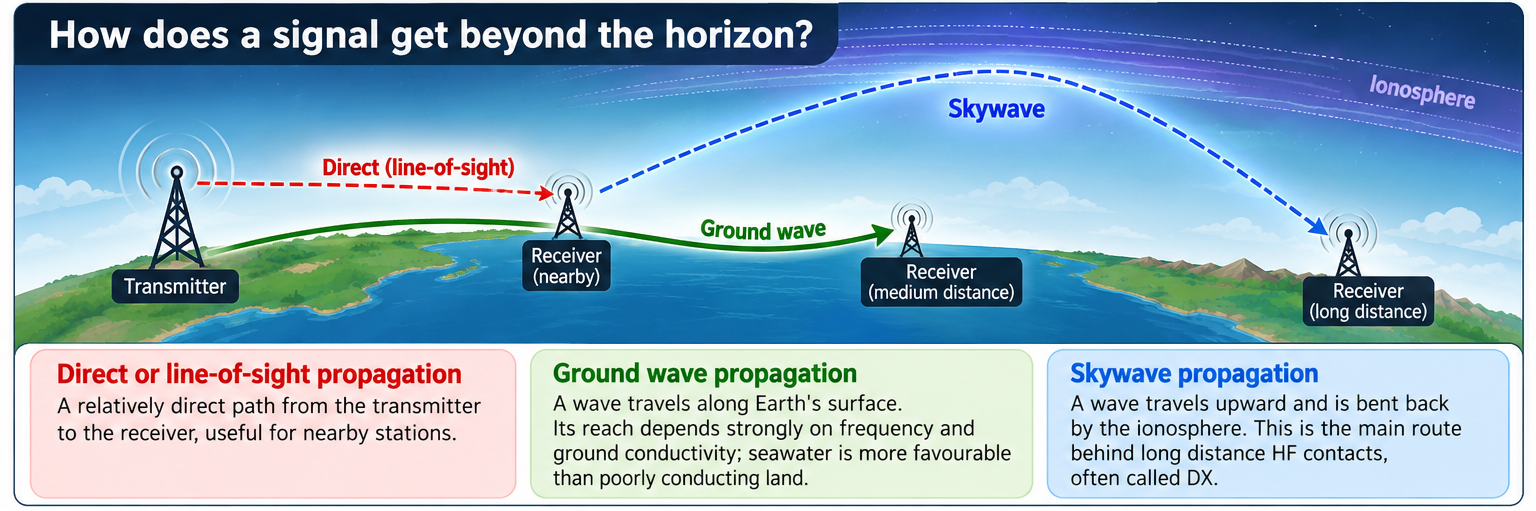
- Direct or line-of-sight propagation: a relatively direct path, useful for nearby stations.
- Ground wave propagation: a wave travels along Earth's surface. Its reach depends strongly on frequency and ground conductivity; seawater is more favourable than poorly conducting land.
- Skywave propagation: a wave travels upward and is bent back by the ionosphere. This is the main route behind long distance HF contacts, often called DX.
The familiar phrase “bouncing off the ionosphere” is a useful first picture. More precisely, changing electron density refracts the wave along a curved path; there is no solid ceiling overhead. Some journeys involve several ionospheric returns, with reflections from land or sea between them. These are called multiple hops. Not every frequency or launch angle will return to the intended destination.
What does the ionosphere actually do?
Solar extreme ultraviolet and X-ray radiation can knock electrons free from atmospheric atoms and molecules. The resulting mixture of ions and free electrons changes how radio waves travel. Its structure varies with sunlight, season and solar activity.
For a first HF listening session, remember three names:
| Region | Why it matters for HF |
|---|---|
| D region | Absorbs some of the signal passing through it; usually much weaker at night. |
| E region | Can return some HF signals. Sporadic E can create unusual openings. |
| F region, especially F2 | Central to many long distance HF paths and still present at night. |
These are changing regions, not rigid shells. A favourable F region does not help if too much signal is absorbed before it gets there and back.
Why do HF conditions change between day and night?
At night, reduced D-region absorption often helps lower HF bands. At the same time, reduced ionization can make higher frequencies less likely to return. A lower band may therefore improve while a higher band becomes less useful. “HF works better at night” is too broad: the answer depends on the band and the whole path, not just the clock at your own station.
Try it: open the IonoFlux Dashboard, enable the day/night boundary and live reception paths, then filter the reports by band. Look for differences between 20 m and 40 m. Compare the map timestamp as well: two displays from different times are not a controlled comparison.
How do you choose a useful frequency?
Two limits help explain the choice. The maximum usable frequency (MUF) describes an upper usable frequency for a particular ionospheric path and set of conditions. The lower end of the usable range is constrained by absorption and whether the signal can overcome noise. MUF alone does not tell you whether a message will be readable.
Imagine a hypothetical path with a predicted MUF of 18 MHz. A 14 MHz signal is a candidate for that path; a 21 MHz signal is above that predicted limit. This is an explanation, not a current forecast or a promise that 14 MHz will work. Antennas, noise, absorption and changes in the ionosphere still matter.
In IonoFlux, use the Dashboard MUF layer for a broad view, then use Path Prediction for your actual pair of locations. A map value at one location is not automatically the MUF for an entire intercontinental route. The service's MUF explanation is a useful companion.
Does more solar activity always mean better HF?
No. Solar radiation helps create the ionosphere, but solar flares can also increase D-region absorption and disrupt HF on the sunlit side of Earth. Energetic particle events can affect polar paths. These are different mechanisms, so one “solar activity” number cannot explain everything.
The Kp index measures geomagnetic disturbance; it is not a signal-strength meter or a verdict on every band. Read it alongside the route and other conditions.
On the Dashboard, compare Kp, solar flux, X-rays and alerts with the paths being reported. This helps you ask a better question: “What might be affecting this route?”
A five-minute HF propagation exercise in IonoFlux
You do not need a transmitter to explore a prediction. Use this Seoul–Tokyo example at 14.074 MHz. These are example model inputs, not a claim about current reception or a transmission recommendation.
- Check the inputs. The link supplies coordinates for Seoul and Tokyo, FT8 mode, 100 W and rural noise. Change them to represent the question you want to investigate.
- Read the path result. Compare its predicted MUF, availability and band estimates. A displayed reliability percentage is a model estimate, not a measured success rate for your station.
- Change one input. Try 7.074 MHz with the same endpoints and other settings. Compare the estimates instead of assuming a lower frequency is always better.
- Explore time. The optional time field uses UTC. For example, 12:00 UTC is 21:00 in Korea and Japan. The 24-hour forecast, when available, offers another view of candidate times and bands; it is not a future observation.
- Compare with reception reports. Look at the nearby observations when present, and check the Dashboard. A report is evidence that a receiver heard a transmitter in one direction at that time. It does not establish a completed two-way contact or guarantee the same result at your location.
No reports can mean no participating stations, delayed collection or limited coverage. It does not prove that the band is closed. Use Data Status to check freshness and Data Sources for provenance and model limitations.
IonoFlux uses a simplified physical prediction method informed by ionospheric data. It does not model every mechanism: E-layer and sporadic-E propagation are excluded from the path model, and antenna patterns are simplified. The forecast also has persistence assumptions. Treat it as a planning aid and read the result's details before interpreting unusual openings. IonoFlux data sources
Frequently asked questions
Do HF signals literally bounce off a layer?
“Bounce” is shorthand for a return path. Refraction through the ionosphere is the more accurate explanation for ordinary HF skywave propagation.
Why can I hear a distant station but miss a closer one?
The nearby receiver may be beyond useful ground-wave coverage but short of where a skywave returns. This can create a skip zone. Antennas and local noise can also explain a missing station.
Is there one best HF band for everyone?
No. Choose for the path, time and equipment. Compare a path prediction with recent reception evidence, rather than treating a worldwide map as a guarantee for every station.
Does an FT8 report mean voice communication will work?
No. FT8 and voice have different signal requirements. In Path Prediction, select the mode you intend to assess; evidence of a weak digital signal is not evidence of intelligible voice on the same route.
Continue exploring HF Path
Start with the live Dashboard, then compare a path of your own. If you want to work with the underlying data, the Developer Center explains the API and SDKs.
Next in the series: What Is Maximum Usable Frequency (MUF)? The article is planned; until it is published, see the existing MUF guide. Find published instalments in the HF Path blog category.
References and further reading
Sources and service documentation checked on 21 October 2026. Examples in this article are illustrative inputs, not timestamped measurements.
- Australian Bureau of Meteorology — Introduction to HF Radio Propagation: skywave, ionospheric regions, day/night changes and frequency selection; PDF edition.
- Australian Bureau of Meteorology — Understanding GRAFEX Frequency Predictions: usable frequency ranges and planning.
- NOAA SWPC — Ionosphere: ionization and the Sun–ionosphere connection.
- NOAA SWPC — D Region Absorption Predictions: HF absorption and its interpretation.
- NOAA SWPC — HF Radio Communications: flare, particle and auroral effects.
- NOAA SWPC — Planetary K-index: geomagnetic disturbance.
- ARRL — Wireless Phenomena: propagation paths and skip zones.
- NASA — Ionosphere Graphics: ionization and day/night changes.
- ITU-R P.533 — Method for the prediction of the performance of HF circuits: technical background for readers ready for formal prediction methods; this does not imply that IonoFlux implements the full recommendation.
#HFPropagation #HFRadio #Ionosphere #SkywavePropagation #ShortwaveRadio #AmateurRadio #SpaceWeather #MUF #FT8 #IonoFlux